



Wolf Street, reading the Census Bureau’s survey, estimates 15.81 million vacant housing units, most of them vacation homes, rentals waiting for tenants and houses held off the market. ATTOM finds 8,482 abandoned ones in foreclosure. The gap between those numbers decides who gets paid.
The 90-day pile has stopped growing. The foreclosure pile has not.
HUD’s August report shows FHA loans 90 or more days past due peaked at 5.68 percent in February on its unadjusted count and slid to 5.24 percent. Loans in foreclosure rose in nearly every month over the same stretch, from 0.48 percent in January to 0.63 percent.
That is 52,730 FHA loans in foreclosure, up from 34,533 a year earlier. Claims HUD paid on completed foreclosures reached 1,960 in one month, up 45 percent.
Run HUD’s own rate against its own count and roughly 441,000 FHA loans sit 90 days or more past due. The line behind the foreclosure pile is long.
The Delinquency Rate Overstates The Pain. The Foreclosure Count Does Not.
FHA’s 90-day rate jumped from 3.57 percent in September 2025 to 5.23 percent in January, and nearly all of that was a paperwork effect. A Center for Responsible Lending analysis found that without FHA’s new trial payment plan requirement the rate would have reached only 3.70 percent in January. Ginnie Mae temporarily excluded trial-plan loans from issuer delinquency ratios this spring.
Those plans keep borrowers counted as delinquent, and HUD’s August count still includes loans under loss mitigation review. A foreclosure filing is different. It is a loan that ran out of options, and the count of those is rising.
The chief executive of DLS Servicing, which works with 59 servicers, told Mortgage Professional America that trial plans first failed about 60 percent of the time and now fail 40 to 50 percent. She expects two to three years of heavy FHA foreclosures. That is her forecast, and Foreclosurepedia reports it as hers.
Every Agency Tells The Same Story At Different Volumes
MBA’s second quarter survey put FHA delinquency at 11.79 percent, up 122 basis points in a year. VA stood at 4.89 percent, up 57. Conventional loans sat at 2.72 percent, up 12.
The serious end is starker. Loans 90 days late or in foreclosure rose 227 basis points for FHA, 31 for VA and six for conventional. In the first quarter FHA’s foreclosure inventory hit its highest level since 2018 and VA’s foreclosure rate its highest since 2017.
Fannie Mae and Freddie Mac barely moved. FHFA reports their serious delinquency rate unchanged at 0.59 percent. The stress sits in government-backed loans, where borrowers put the least down.
ICE’s September data counts 303,000 loans in pre-sale foreclosure, up 82,000 in a year, the highest active inventory since early 2019. Completed foreclosure sales rose 15 percent to 8,200. Loans originated in 2022 or later made up 43 percent of starts and 49 percent of sales.
None of that is a crisis, and Foreclosurepedia will not call it one. ICE puts the share of seriously delinquent loans at 1.04 percent, in line with the 2017 to 2019 average of 1.06 percent, and said in August that sales ran at 57 percent of the 2019 pace. The line is moving the wrong way from a low base, and the pipeline behind it is full.
15.81 Million Vacant Units. 8,482 Zombies.
Wolf Street’s reading of the Census Bureau survey estimates 15.81 million vacant housing units in the third quarter, up 591,000 in a year. Of those, 12.34 million are year-round vacant. A section header in Wolf’s piece says 12.84 million, but the components add to 12.34, and Foreclosurepedia uses the number that adds up.
The share is not new. Census put vacant units at 12.4 percent of the housing stock in the third quarter of 2018 and 10.3 percent in the third quarter of 2025. Today’s 15.81 million is about 10.6 percent. What has changed is the slice on the market, up 7.1 percent in a year.
That slice is 4.93 million units for sale or rent, about 3.3 percent of the stock and the most since 2013. For-rent vacancies alone reached 3.87 million, the most since 2011. Another 6.51 million are held off the market, and 3.47 million are seasonal.
Now read the other count. ATTOM matched county tax records against vacancy data and finds 1.3 percent of 104.6 million residential properties empty, flat for a year. Of 259,666 properties in foreclosure, 8,482 are zombies, abandoned before the sale.
The two counts measure different things. Census counts seasonal homes, rentals waiting for tenants and houses held off the market. ATTOM counts occupancy. Neither tells you how many empty houses a lender will send an Inspector to visit.
The foreclosure pipeline tells you that, and it runs long. HUD’s data puts the average FHA path from first missed payment to REO sale at 31.8 months.
Investor-owned homes sit empty at 3.5 percent, more than double the national rate, ATTOM says. Youngstown, Cedar Rapids, Baltimore, Fort Wayne and Akron lead the metro zombie rates, at 10.5 to 12.1 percent. Four of those five are in the Midwest.
HUD’s loss data shows where some of the money goes. Holding costs, which include maintenance, repairs and security, ran 6.26 percent of the defaulted balance in July. On the $205,141 average balance, Foreclosurepedia calculates about $12,800 per property.
That is the work, and it arrives late. Foreclosurepedia has heard the same from the field: pre-conveyance order volume has barely moved in a year, even as FHA defaults climbed.
The Flip Is Squeezed At The Exit
ATTOM’s second-quarter report puts flips at 6.2 percent of all sales, down from 7.3 percent a year earlier. The typical gross margin fell to 21.5 percent from 27.6 percent. ATTOM’s margin leaves out rehab and other costs, which flipping veterans estimate run 20 to 33 percent of the after-repair value.
Texas is where it breaks. In San Antonio the typical flip lost 0.3 percent. Dallas, Austin and Houston managed 1.8, 2.8 and 3.7 percent.
The exit is the problem. Zillow reports values down half a percent in September and pending sales falling. Investor purchases dropped 22 percent in the second quarter, BatchData says, and small investors made up 66.2 percent of investor purchases in the first half, Realtor.com reports, their highest share in at least 15 years.
A flip that does not sell gets a second life. Scotsman Guide reports that a significant share of the surge in DSCR lending comes from investors pushed there by a fix-and-flip market that no longer assures a clean exit. That is how a failed flip becomes another rental.
The flip hot spots sit on the distress. Macon and Fayetteville rank among ATTOM’s five top flip-rate metros in the second quarter and among its five worst foreclosure-rate metros in the first half. Akron is a top-five flip metro and a top-five zombie metro.
Fix And Rent Works Where The Renters Are
The national rent numbers disagree, which should make anyone cautious. Apartment List has national rent down 0.4 percent in a year. Zillow has it up 2.7 percent.
Census put the third-quarter rental vacancy rate at 7.6 percent, higher than a year ago. Apartment List’s multifamily vacancy peaked at a record 7.3 percent in February and sat at 7.0 percent in September.
Supply is falling from the 2024 peak, but the data disagree about how far. CoStar counts first-quarter starts at their lowest since 2011. Yardi counts first-half starts up 20 percent. ALN counts 731,000 units under construction, up 17 percent, and expects 2027 deliveries 23 percent above 2026.
Demand cooled in the third quarter. ALN had net absorption down 52 percent from a year earlier, though it calls the quarter consolidation, not deterioration.
The national picture hides a map.
Texas Is Where The Supply Landed
Austin, Dallas-Fort Worth, Houston and San Antonio each grew their housing stock more than 12 percent from 2020 to 2025, against 6.6 percent for all large metros, an Urban Institute analysis shows. That count includes owned homes, not only apartments.
CoStar put apartment vacancy in the first quarter at 15.7 percent in San Antonio, 15.6 in Memphis, 14.0 in Austin, 12.7 in Houston, and 12.4 in Dallas-Fort Worth, Charlotte and Phoenix. ALN counted concessions at 55 percent of San Antonio properties at the end of June, 54 percent in Austin and 45 percent in Houston. Apartment List has San Antonio’s median rent down 5.1 percent in a year.
CoStar expects San Antonio vacancy to ease only to 13.7 percent by 2028.
Houston depends on who is counting. Northmarq has area vacancy at 7.1 percent in the second quarter, Apartment List 8.4 percent in August, Lee & Associates 12.2 percent, and CoStar 12.7 percent in the first quarter.
The debt is worse than the vacancy. Trepp says $3.04 billion across 130 performing floating-rate agency apartment loans in Texas report debt coverage below 1.0, a quarter of the performing balance, even though the loans are current. Loans from 2021 and 2022 hold 87.5 percent of the delinquent floating-rate dollars.
Foreclosurepedia warned last October of a Houston Class C wave. The debt side has delivered. The rent side is mixed, with Cushman & Wakefield reporting accelerating Houston demand in the second quarter and CoStar reporting in September that vacancy in one of Houston’s cheapest apartment markets hit a 15-year high.
Florida Stacks Three Problems
Florida has the worst foreclosure rate in the nation, 0.27 percent of housing units in the first half. In Cotality’s July single-family rent index, all four annual declines among the 50 largest metros were in Florida. Insurance is the cost no landlord can negotiate.
Tampa vacancy was 8.0 percent in the first quarter, up 100 basis points in a year, with rents down 1.1 percent, Northmarq says. Miami is the exception, at 6.4 percent vacancy in January with rents up 0.7 percent.
Atlanta Shows Class C In One Line
RealPage’s first-quarter data has Atlanta Class A rents up 2.2 percent and Class C rents down nearly 5 percent, extending a multi-year streak of cuts. LeaseLock’s chief economist expects trouble for the Class C product built in the 1980s in Phoenix, Florida and Texas. Georgia foreclosure activity rose 52 percent in the first half, ATTOM says.
The Midwest Has Tight Rentals And Rotting Houses
RealPage had Chicago rents up 3.5 percent with occupancy at 96.3 percent in the first quarter, and Cotality has Chicago single-family rents rising near 5 percent. ALN found only about 10 percent of properties in Buffalo, Chicago, Detroit, Cleveland, Philadelphia and Dayton offering concessions.
Midwest apartment rents rose only 1.7 percent in the year to the second quarter, 160 basis points below the regional norm, with job cuts emerging as a headwind. By Realtor.com’s measure, Milwaukee’s vacancy more than doubled in 2025, from 4.9 to 10.8 percent.
The same region leads the zombie lists. ATTOM counts 602 zombie properties in Ohio and 344 in Indiana, against 298 in California and 166 in Texas.
The Coasts And The Mountains
Realtor.com counts Boston and New York among only six landlord-friendly markets in the 50 largest. Moody’s, cited by JPMorgan, had Orange County Class B and C vacancy at 2.9 percent in the first quarter against 6.5 percent for Class A. The Mountain West follows Texas, with Salt Lake City and Denver on Apartment List’s renter’s-market list and Idaho and Colorado foreclosure filings up 59 and 57 percent in the first half.
Class C is the common thread. ALN had Class C effective rents down 0.3 percent and Class D down 2.5 percent over the twelve months through April, with concession availability up 16 percent for Class C and more than 40 percent for Class D. In the first half, Class C and D net absorption fell 38 and 57 percent from a year earlier while Class A and B rose.
LeaseLock’s chief economist ties the weakness to slowed immigration shrinking the renter pool.
The Renovation Bet: Pay Now, Wait For A Renter Pool That Is Shrinking
A value-add plan has four moving parts: buy, renovate, lease, and sell or refinance. Each one is exposed this year.
The buy. Apartment cap rates reached 5.79 percent in the second quarter, the highest since 2015, and MSCI has prices down 1.7 percent in a year. Prices are still resetting.
The debt. The 10-year Treasury touched about 5.35 percent on October 8, a 24-year high, and has closed between roughly 5.0 and 5.2 percent since. A broker’s rate sheet on October 6 quoted Freddie Mac multifamily loans at 6.23 to 6.47 percent. A building bought at a 5.79 percent yield with a loan that costs more than that pulls the equity’s return below the property’s own yield.
NMHC’s October survey of 130 multifamily executives put its debt financing index at 10, down from 46 in July, with 81 percent reporting worse borrowing conditions.
The renovation. Cost inflation is not the main risk. Verisk has repair and remodeling costs up 2.54 percent in the first quarter, with labor over 64 percent of the budget. NAHB has building materials up 3.7 percent from a year earlier, and 5.9 percent for inputs including energy.
The risk is a budget and a schedule that slip while rents move the wrong way. Lenders suggest flippers hold 10 to 15 percent contingencies, and rental renovation guides run up to 20 percent. Contingency does not pay for a roof discovered after closing.
The vacancy during the work. Every unit under renovation collects no rent, and underwriting guides tell operators to model those down months. An owner who takes units offline in a market where CoStar counts 12.7 percent vacancy is selling his own cash flow.
The premium. One common underwriting example spends $12,000 per door to earn $220 more per month, a 22 percent return on cost. Class C rents are moving the wrong way. On a $1,300 rent, a 5 percent drop costs $65 a month, nearly a third of that $220 premium.
The exit. Buyers underwrite against cap rates at an 11-year high, and NMHC’s sales volume index fell to 22 from 46. Multifamily CMBS delinquency hit 8.04 percent in September against 6.59 percent a year earlier, and CRED iQ says rising operating expenses, deferred maintenance, code violations and fires pushed loans into trouble this summer.
The worst losses sit with owners who bought at the peak on floating-rate debt, and Trepp’s Texas numbers show where. The next buyer faces a different problem, and the supply drop could rescue a patient owner with little debt. Foreclosurepedia expects Class C to be the last tier to recover, because demand, not supply, is its problem.
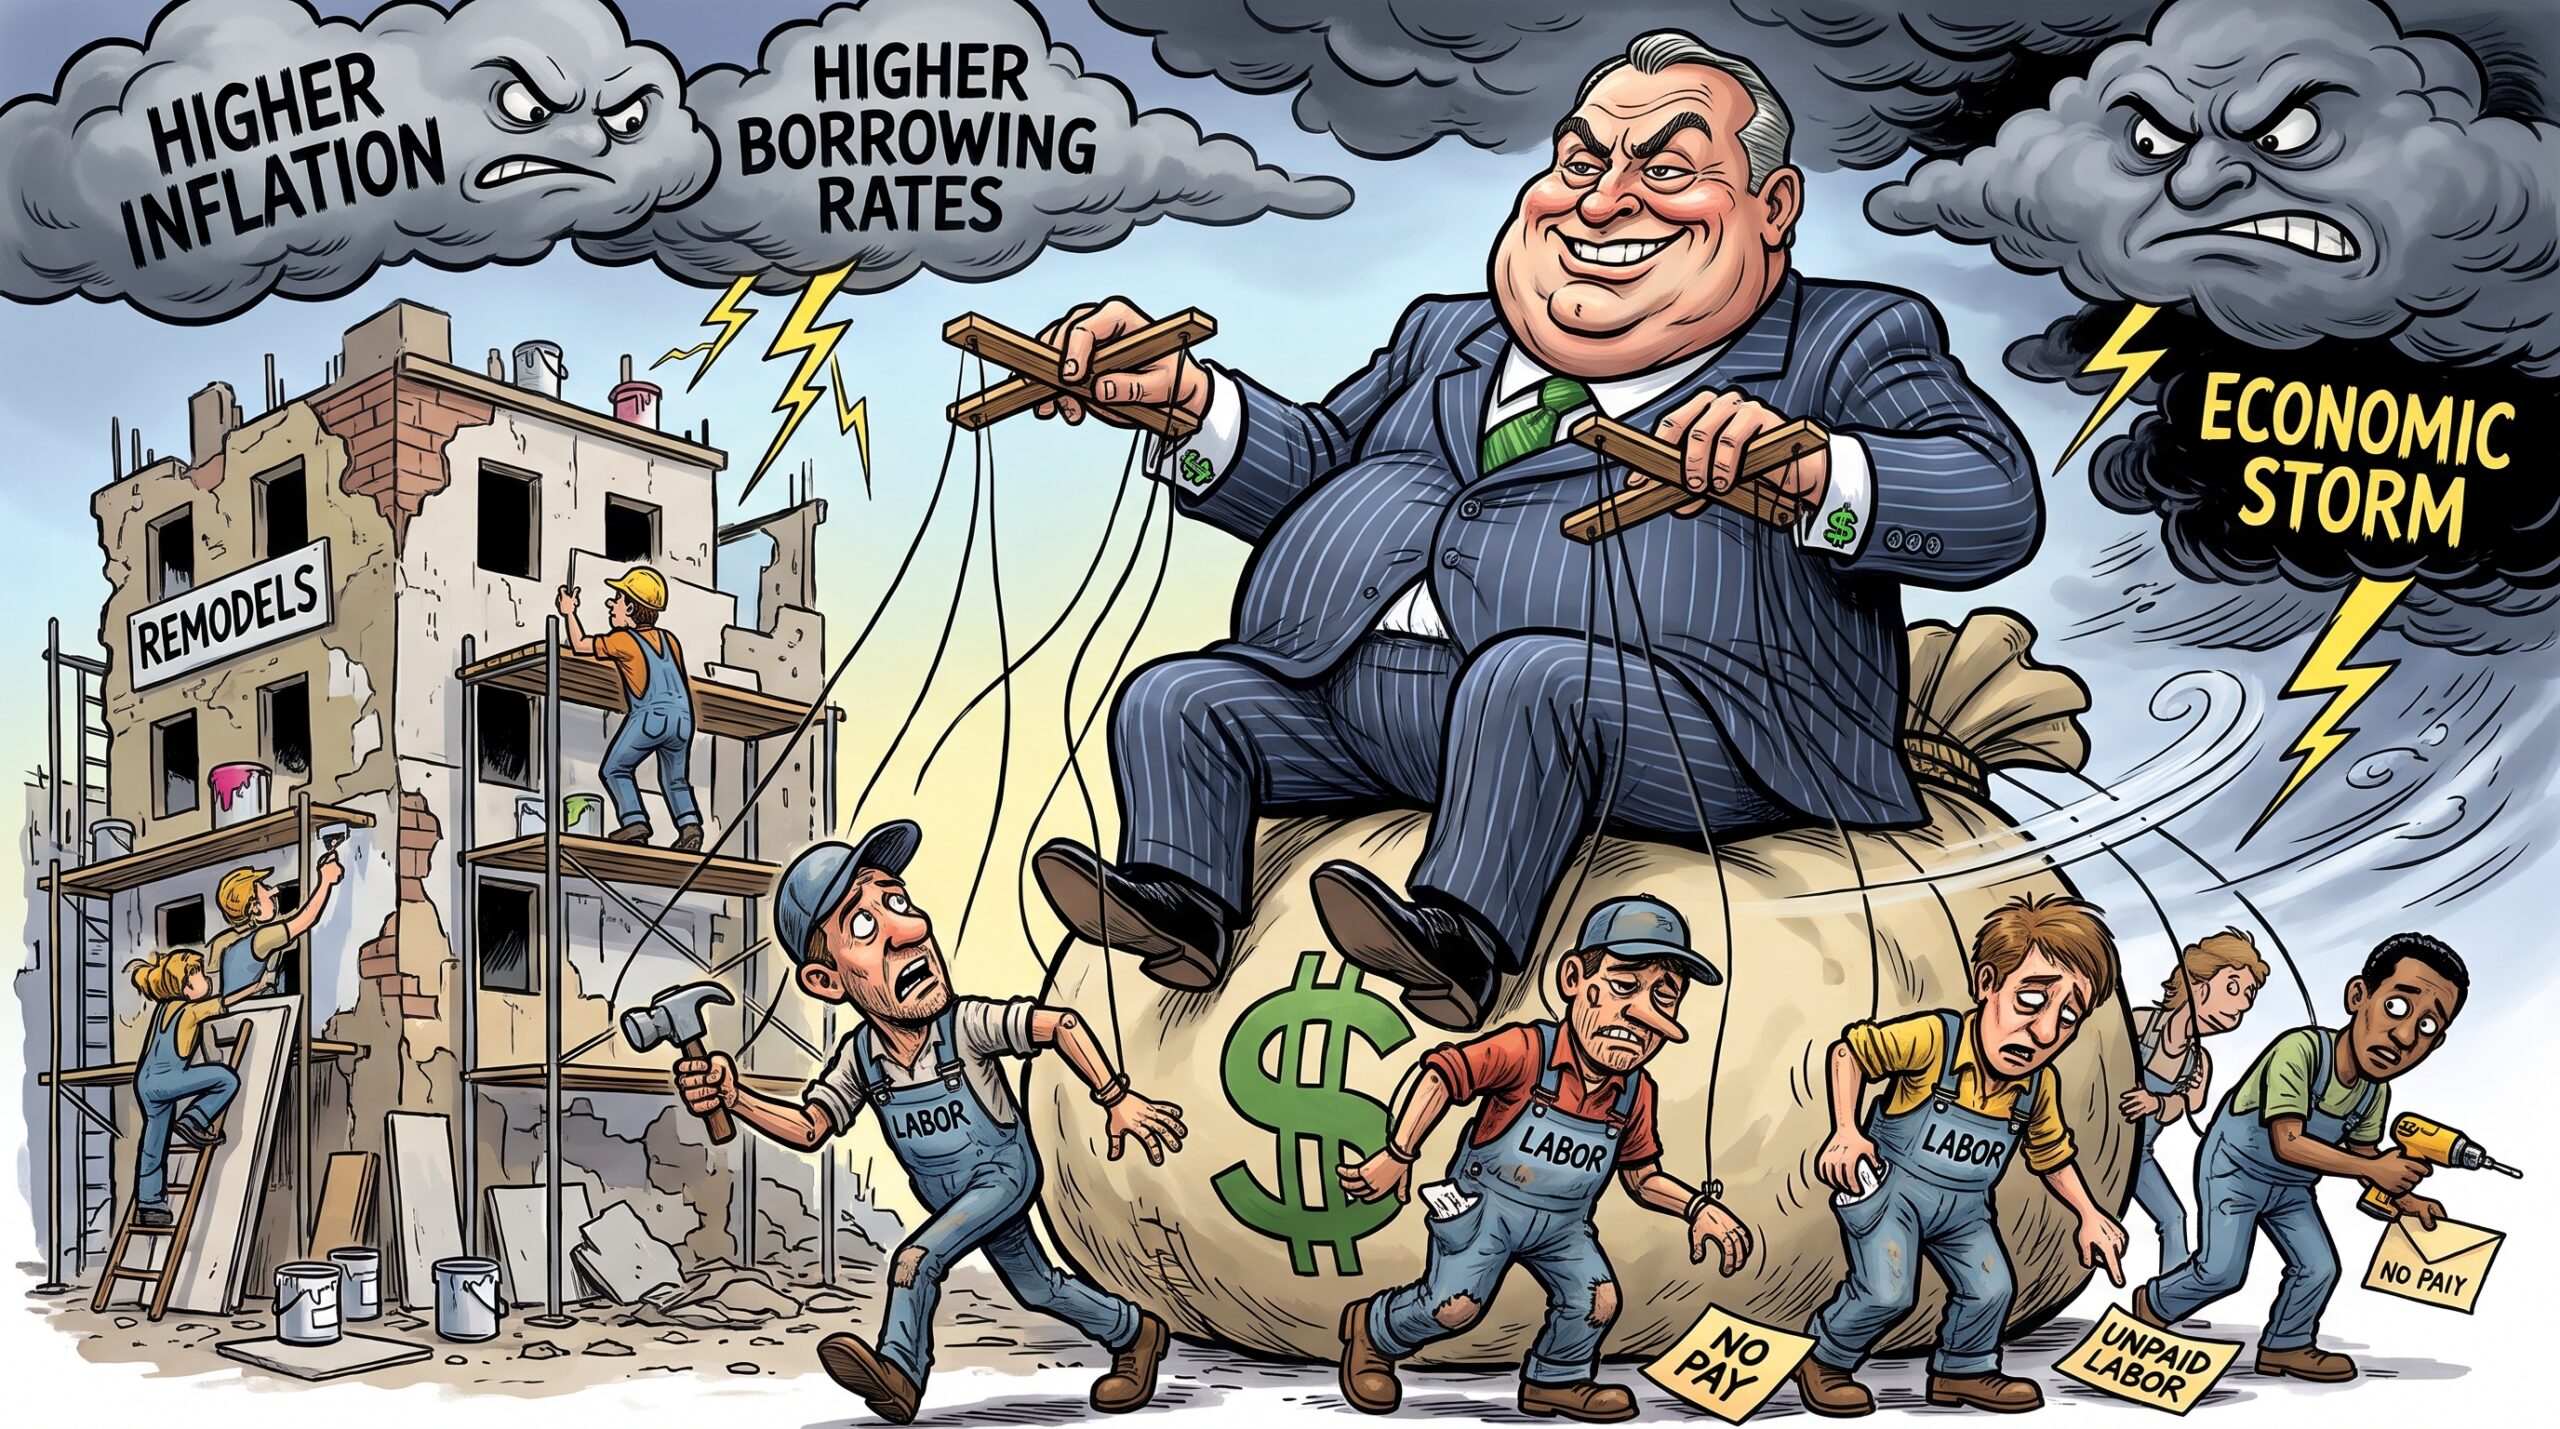
Labor Gets Paid Last By The Owners Who Can Least Afford To Pay
Owners squeezed by debt coverage below 1.0 have every reason to contest charges and delay approvals, and Foreclosurepedia has long reported that distressed owners do. Field Service Technicians and Inspectors have watched it for two decades.
Every path above ends with the same request. Someone must document the property, secure it, mow it and winterize it. Pre-conveyance work arrives late. Class C work arrives from owners in distress.
Get the work order in writing. Know who pays. Know whether the owner’s lender is in special servicing.
The vacancy count is a survey. The foreclosure count is a filing. Labor does the work in between, and Labor is owed for it.